

In consumer electronics, a single stuck green sub-pixel on a television or a minor edge-lit backlight bleed on a laptop monitor is often dismissed as a minor cosmetic quirk. However, in mission-critical applications, display imperfections are unacceptable.
Consider a digital surgical display where a cluster of dark sub-pixels mimics micro-calcifications on a high-resolution mammogram, an avionics primary flight display (PFD) where backlight non-uniformity obscures flight vector instrumentation in peripheral vision, or an industrial chemical processing interface where an uncalibrated touch screen registers an emergency valve shutoff millimeters away from the intended target. In these high-stakes environments, display non-conformity can lead to critical operational failures, regulatory compliance rejection, costly product recalls, or severe safety risks.
Standard commercial LCD panels direct from mass-production glass foundries are manufactured to commercial grade tolerances. Standard factory warranties frequently allow for a baseline number of dead sub-pixels, subtle luminance gradients, and broad touch controller calibration tolerances.
To bridge the gap between commercial manufacturing tolerances and the zero-tolerance requirements of aerospace, defense, medical, and heavy industrial original equipment manufacturers (OEMs), AGDisplays provides advanced LCD Inspection and Quality Assurance Services.
This comprehensive guide explores the physics, metrology, and engineering methodologies behind three pillars of display qualification: Zero Pixel Inspection, Photometric Luminance & Uniformity Analysis, and Precision Touchscreen Calibration.
The Quality Reality Gap: Why Mass-Market LCD Yields Fall Short
To understand the necessity of specialized LCD inspection, one must examine how thin-film transistor (TFT) liquid crystal panels are manufactured.
A modern high-definition display panel comprises millions of microscopic sub-pixels. For example, a standard 4K UHD display (3840 x 2160 resolution) contains over 8.29 million individual pixels, which equates to nearly 24.9 million individual RGB sub-pixel transistors deposited across thin glass substrates inside a fabrication facility.
Given this component density, achieving a 100% perfect transistor yield across massive motherglass sheets is statistically challenging. If panel manufacturers discarded every panel with a single imperfect sub-pixel, manufacturing yields would drop and display costs would rise.
To balance yields, the display industry established standard defect tiers under ISO 9241-307 (formerly ISO 13406-2). Most off-the-shelf commercial and industrial-grade panels are sold under Class II standards, which legally allow multiple defective pixels per million pixels:
ISO 9241-307 Pixel Fault Classification Standards
| Defect Classification | Type 1: Hot Pixel (Always White) | Type 2: Dead Pixel (Always Black) | Type 3: Stuck Sub-Pixel (Red/Green/Blue) | Cluster Faults (Sub-Pixels in 5×5 Area) |
| Class 0 (Zero Defect) | 0 | 0 | 0 | 0 |
| Class I | 1 | 1 | 2 | 0 |
| Class II (Standard Commercial) | 2 | 2 | 5 | 2 |
| Class III | 5 | 15 | 50 | 5 |
| Class IV | 50 | 150 | 500 | 50 |
For defense contractors, medical equipment designers, and high-reliability industrial automation OEMs, Class II or even Class I tolerances are unacceptable. Deploying a display with a stuck sub-pixel or localized luminance clouding can cause field failures and customer dissatisfaction.
AGDisplays eliminates this supply chain risk through 100% incoming and outgoing White Glove Optical Inspection.
Pillar 1: Zero Pixel Inspection Methodology
The AGDisplays Zero Pixel Inspection program guarantees that displays integrated into mission-critical systems conform strictly to ISO 9241-307 Class 0 standards—ensuring zero bright sub-pixels, zero dead pixels, and zero optical particulate contamination within the active viewing area.
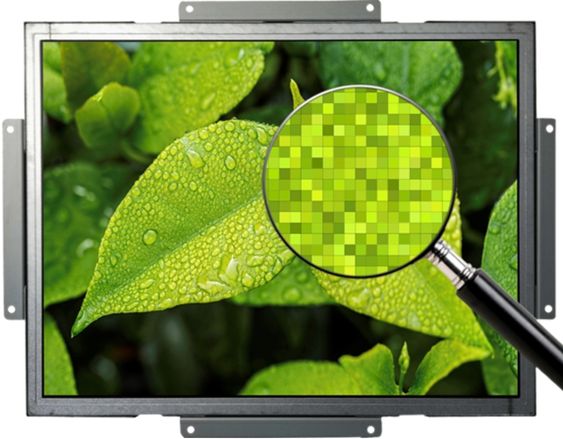
Sub-Pixel Electrical Failure Modes
Understanding pixel defects requires examining the electronic structure of the active matrix TFT:
- Stuck-On (Hot) Sub-Pixels: Occur when an individual TFT drive transistor suffers a source-to-drain short circuit or gate insulation breakdown. In a “Normally Black” liquid crystal mode (such as In-Plane Switching, or IPS), a shorted transistor leaves the sub-pixel fully energized, resulting in a continuous, bright pin-point of red, green, or blue light.
- Dead (Dark) Sub-Pixels: Occur when a transistor open circuit or broken indium tin oxide (ITO) pixel electrode prevents voltage from reaching the liquid crystal cell. The sub-pixel remains un-energized, creating a permanent black spot.
- Polarizer and ITO Contamination: Microscopic airborne lint, dust particles, or conductive debris trapped between the liquid crystal cell and the external polarizing films can create dark circular shadows that mimic dead pixels.
Inspection Procedures & Metrology
Zero pixel certification takes place inside an ISO Class 5 (Class 100) cleanroom environment using specialized optical inspection fixtures:
- Multi-Spectrum Visual Cycling: Displays are driven through full-screen, high-purity color test patterns:
- Full Black Pattern (0 IRE): Identifies bright hot pixels, stuck sub-pixels, and backlight frame leakage.
- Full White Pattern (100 IRE): Detects dead sub-pixels, dark spots, and internal particulate shadows.
- Pure Primary Fields (Red, Green, Blue at 100% saturation): Isolates individual sub-pixel transistor failures that may hide against complex background graphics.
- Optical Microscopic Verification: When an anomaly is detected, technicians utilize high-resolution digital optical microscopes (50 x -200x magnification) to analyze the fault geometry. This differentiates between a true semiconductor transistor fault, an internal liquid crystal alignment defect, or a removable surface particle.
- Cross-Polarized Film Inspection: Utilizing specialized polarization filters, technicians inspect the outer optical stack for mechanical micro-scratches, stress-induced birefringence, and adhesive delamination across the active area.
Pillar 2: Photometric Luminance and Brightness Uniformity Analysis
A display can have zero defective pixels but still fail in operation if its brightness is uneven or its color temperature drifts across the panel.
Brightness Uniformity measures how evenly an LCD’s backlight distributes light across the active screen area. Non-uniform displays exhibit dim corners, bright edges (“hot spots”), yellow/blue color shifts, and cloudy visual artifacts known as Mura.
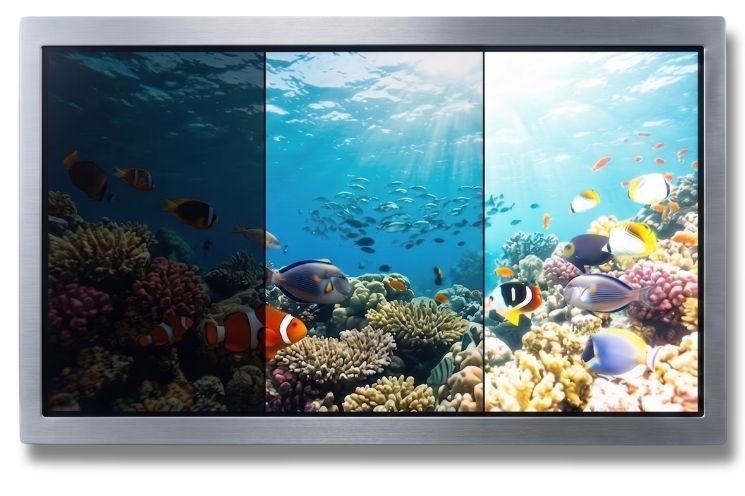
Luminance is measured in candelas per square meter (cd/m²), commonly referred to as nits.
To calculate the Luminance Uniformity (cd/m²) of a display, calibrated photometers measure brightness across a standardized grid of points—typically the 9-point VESA standard, 13-point ANSI standard, or a dense 25-point matrix for high-precision avionics:
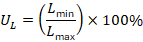
Where:
- Lmin is the lowest luminance value recorded across any grid point.
- Lmax is the highest luminance value recorded (typically at center point P5).
- Standard Commercial Panels: UL≈70%-75% (Dim corners and edge bleed are readily visible to the human eye).
- Industrial & Marine Grade: UL ≥ 80% – 85%
- Medical Diagnostic & Military Cockpits: UL ≥ 90% – 95% (Requires precision edge-lit or direct-lit optical diffuser engineering).
Optical Mura Detection and Color Coordinate Mapping
Mura (a Japanese term for “unevenness”) refers to localized contrast and brightness variations caused by non-uniform liquid crystal cell gaps, mechanical chassis stress, uneven diffuser sheets, or localized LED heating.
- 2D Imaging Colorimetry: Using scientific-grade CCD imaging photometers, AGDisplays maps every pixel across the screen simultaneously. This generates high-resolution false-color luminance heat maps that highlight subtle luminance gradients that point photometers might miss.
- Chromaticity Uniformity (Δ u¹v¹): Color consistency is measured across the CIE 1976 chromaticity color space. By measuring chromaticity coordinates at each grid point, engineers calculate the maximum color shift (Δ u¹v¹):

In medical imaging and military tactical maps, (Δ u¹v¹) must stay below 0.005 across the entire panel surface to ensure consistent color representation.
Pillar 3: Touchscreen Linearity, Precision, and Calibration
Integrating a Projected Capacitive (PCAP) or Resistive touch sensor over an LCD panel introduces electro-mechanical variables that can degrade touch accuracy.
A touch controller maps physical capacitive changes into digital screen pixel coordinates (X,Y). If the sensor grid suffers from electrical noise, mechanical warping, or improper firmware calibration, user touches can drift, jitter, or register off-target.

Key Touchscreen Performance Metrics
1. Touch Accuracy and Spatial Offset ()
Touch accuracy defines the spatial distance between where a physical stylus touches the glass and where the operating system registers the touch coordinate.

- Center Active Area Spec:
.
- Border and Corner Zone Spec:
.
2. Touch Linearity Linearity measures the sensor’s ability to track a straight line across the display without waviness. A robotic CNC gantry draws diagonal lines across the display surface at fixed velocities). Any deviation from the true linear vector is calculated as a linearity error percentage
3. Touch Jitter (RMS Noise)
When a stationary conductive probe rests on the screen, electromagnetic noise from the LCD timing controller or backlight inverters can induce small fluctuations in the reported coordinate. Jitter is calculated as the Root Mean Square (RMS) variation:
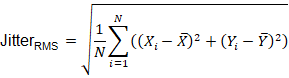
Industrial-grade calibration guarantees touch jitter remains below 0.3mm, preventing shaky virtual sliders or erratic clicks.
Overcoming Edge and Corner Capacitive Boundary Effects
The most challenging areas on a PCAP touchscreen are the extreme outer edges and corners. In the center of a display, an electrode node is surrounded symmetrically by adjacent receive (Rx) and transmit (Tx) electrodes, creating a balanced electrostatic field.
At the edge of the glass, the electrode grid terminates abruptly. The lack of neighboring electrodes distorts the electrostatic fringe field, causing the reported touch coordinate to pull inward toward the center of the screen.
The Calibration Solution:
AGDisplays engineering performs low-level firmware parameter tuning:
- Edge Compensation Matrices: Applies mathematical coordinate expansion algorithms within the touch controller firmware (e.g., EETI, ILITEK, PenMount) to offset boundary field distortion.
- Sensitivity Threshold Mapping: Balances sensitivity across the entire touch surface, ensuring buttons located near the outer bezel respond with the same light touch as center controls.
Pillar 4: Chromaticity and True Color Accuracy
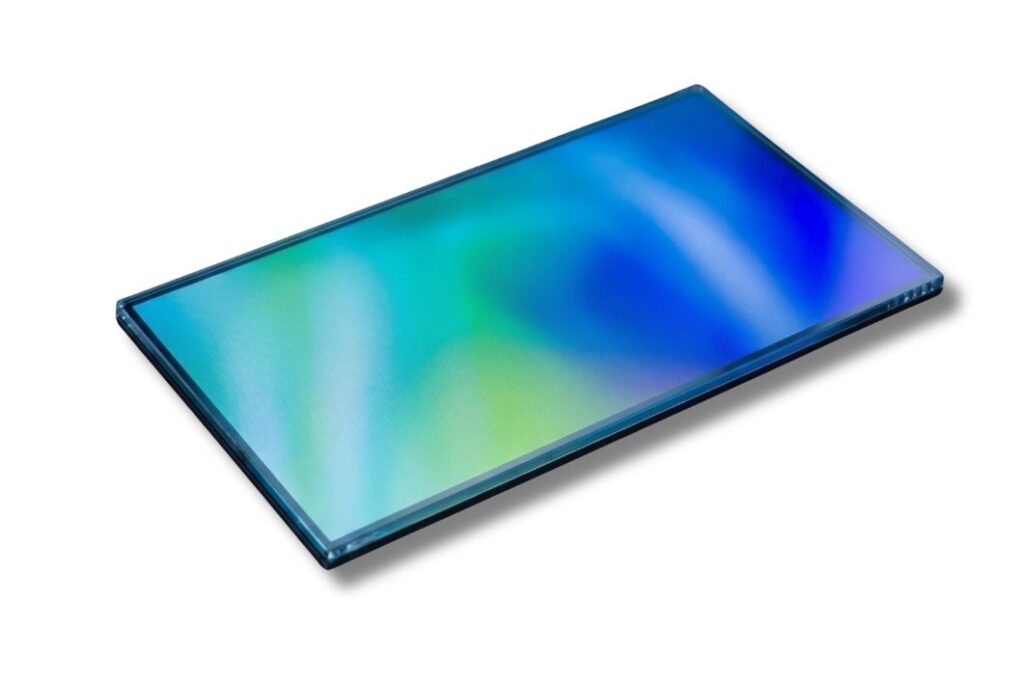
On an office monitor, a screen that looks slightly too warm (yellowish) or cool (bluish) is a minor cosmetic preference. But on a mission-critical display, color is vital operational data.
- In Medical Imaging & Surgery: Surgeons and pathologists rely on exact color reproduction to distinguish healthy tissue from inflammation, bleeding, or disease.
- In Aviation Cockpits: Flight paths, caution alerts, and weather radar data use standardized color codes (aviation red, amber, and cyan) that must be instantly identifiable without ambiguity.
- In Marine & Defense Navigation: Digital nautical charts rely on precise color shades to clearly separate shallow water hazards from safe navigation channels, whether operating in midday sun or total darkness.
Why Standard Factory Panels Drift
Standard out-of-the-box LCD panels are mass-produced with broad color tolerances. Two identical monitors from the same factory can display noticeably different shades of white and color balance.
Worse, when displays are dimmed down for night-time operation in a boat helm or aircraft cockpit, changing LED temperatures often cause the white balance to shift noticeably toward a cool blue or magenta tint.
How AGDisplays Tests and Calibrates Color
To guarantee true color fidelity, AGDisplays tests and calibrates displays in dedicated darkroom laboratories using precision optical equipment:
- Full-Spectrum Color Auditing: Calibrated spectroradiometers scan across dozens of standardized color patches to verify that color error (ΔE) remains invisible to the human eye.
- Stable Dimming Calibration: We calibrate LED driver profiles and hardware Look-Up Tables (LUTs) to keep white balance completely flat and consistent from 100% sunlight-readable brightness down to 0.1% night-vision levels.
- Edge-to-Edge Color Uniformity: We measure multi-point color coordinates across the screen to ensure color temperature remains balanced from corner to corner.
- MIL-STD-3009 NVIS Compliance: For military and defense systems, we verify that screen backlights emit zero infrared light that could blind operators using night-vision goggles (NVGs).
Partnering with AGDisplays for Certified LCD Inspection and Screen Qualification
Display failures in the field lead to expensive warranty claims, delayed program launches, and compromised operational performance. AGDisplays helps OEM system designers, procurement managers, and quality assurance engineers de-risk their display supply chains.
With decades of specialized experience in liquid crystal display enhancement, ruggedization, and testing, AGDisplays offers scalable inspection programs tailored to your exact industry requirements:
- 100% Lot Inspection Programs: Complete optical, electrical, and mechanical qualification of production display batches, screening out sub-standard panels before they enter your assembly line.
- Custom Pass/Fail Thresholding: We align inspection criteria with your exact program specifications—whether you require ISO Class 0 Zero Pixel certification, tight DICOM medical tolerances, or military MIL-STD / DO-160 compliance.
- In-House Cleanroom Rework & Lamination: If a panel exhibits minor optical issues, AGDisplays provides immediate cleanroom rework—including polarizer replacement, dry-film (OCA) and liquid (LOCA) optical re-bonding, backlight LED upgrades, and custom touch integration.
- Serialized Test Documentation: Every inspected display leaves our facility with a serialized Certificate of Conformance (CoC), complete with photometric data sheets and test verification logs.
By partnering with AGDisplays, you can deploy your display systems with confidence, knowing every screen has been tested, calibrated, and certified by industry specialists.
Contact the AGDisplays quality engineering team today to review your project specifications, establish a custom display inspection protocol, or request an evaluation of your incoming LCD lots.
https://shop.agdisplays.com